MARKET TREND
Google Trends & Social Rank
Below is the chart from Google trends generated for “Flexiroam X” as a reference and to compare which year is the least and the most customer using keywords such as “Roaming Data”, “Travel” and “Data Plan” all around the world.
Below is the chart from Google trends generated for “Flexiroam X” as a reference and to compare which year is the least and the most customer using keywords such as “Roaming Data”, “Travel” and “Data Plan” all around the world.
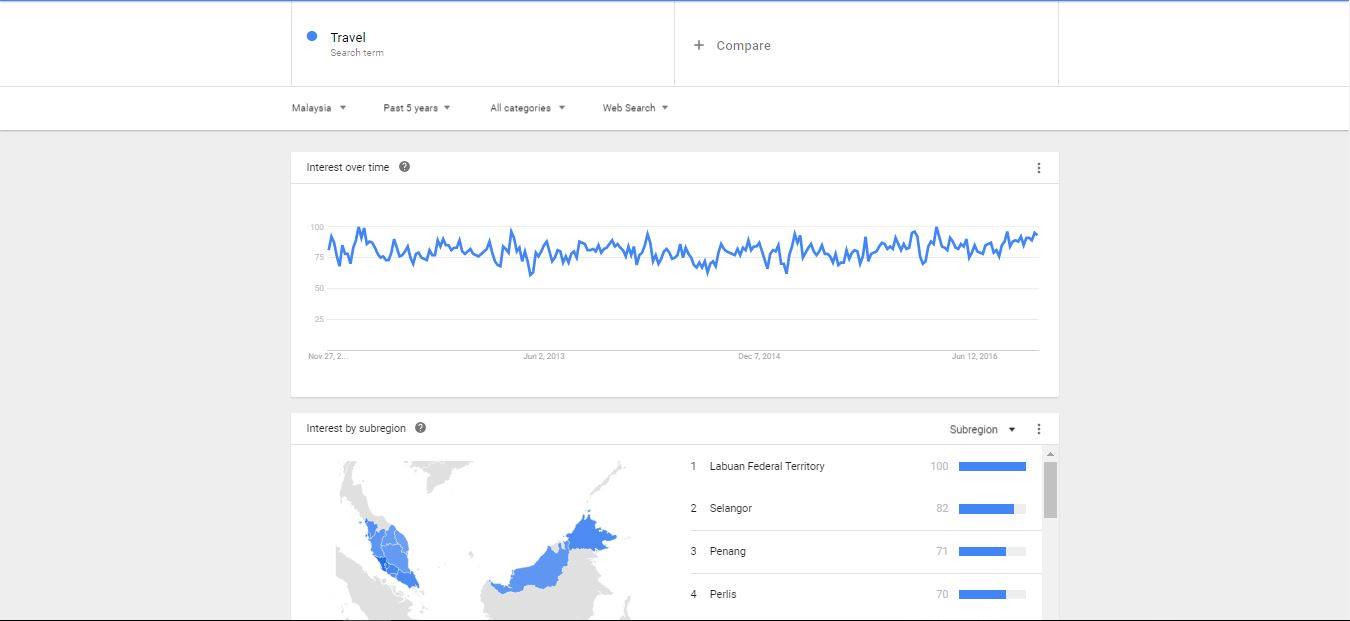
From this chart, it clearly stated that most of the customers searching for the keywords “Travel” in March compared to others. There’s a week school holiday for all the students during this month. At the same time, the price going on a holiday trip on this month is cheaper than going holidays on festive seasons such as Christmas in December. Therefore, many customers choose to go for a holiday during this month.
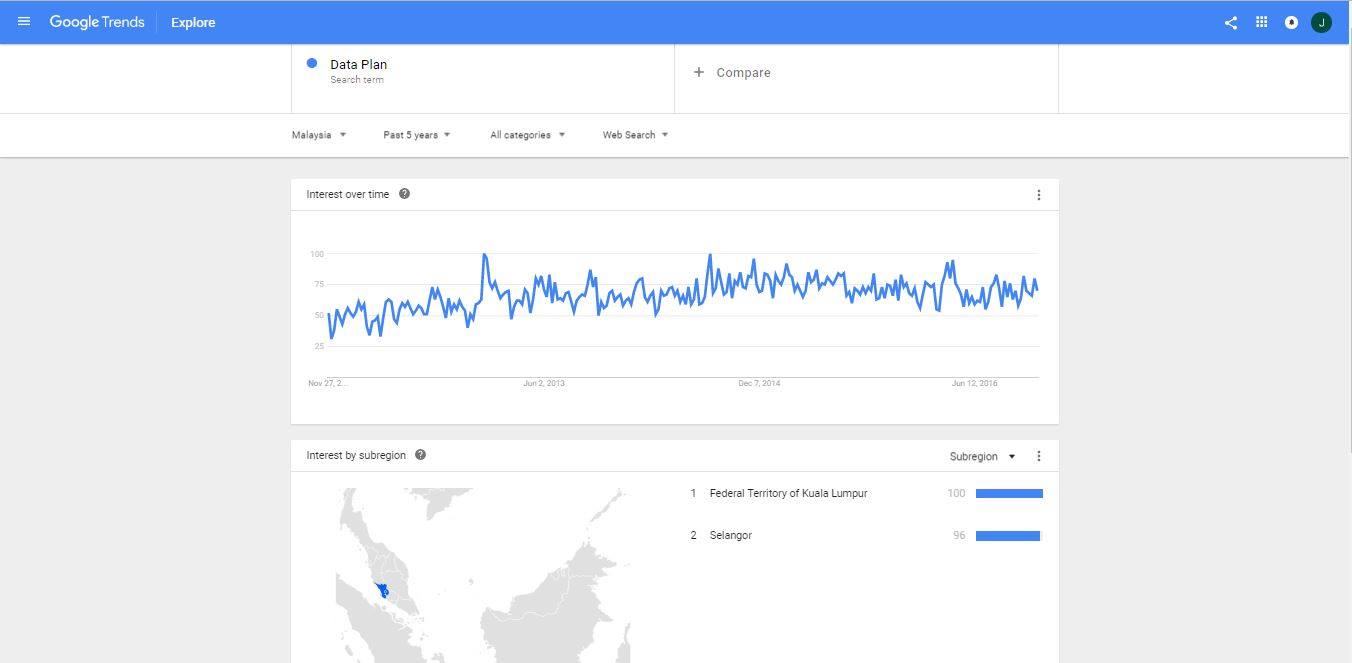
In the second chart, we can clearly see that customers use the keywords “Data Plan” the most in 17th – 23rd April 2016. In the year of 2015, this keyword also appeared the most in 17th – 23th May 2015 and 6th – 12th January 2013. Other than that, the graph also shows us that where the majority people who are interested in this keyword came from. Federal Territory Kuala Lumpur came first, and then Selangor came second. Federal Territory Kuala Lumpur is a city that has more working place and more populations. Also, Federal Territory Kuala Lumpur has the most attractive and interesting place that is able to attract tourists. Tourists that came into Malaysia will definitely go to Kuala Lumpur. Instead of searching for Wifi everywhere, tourist would rather look for a data plan to make their live more convenience. Therefore the chances of using this keyword in Federal Territory Kuala Lumpur is more highly compare to Selangor and other states.
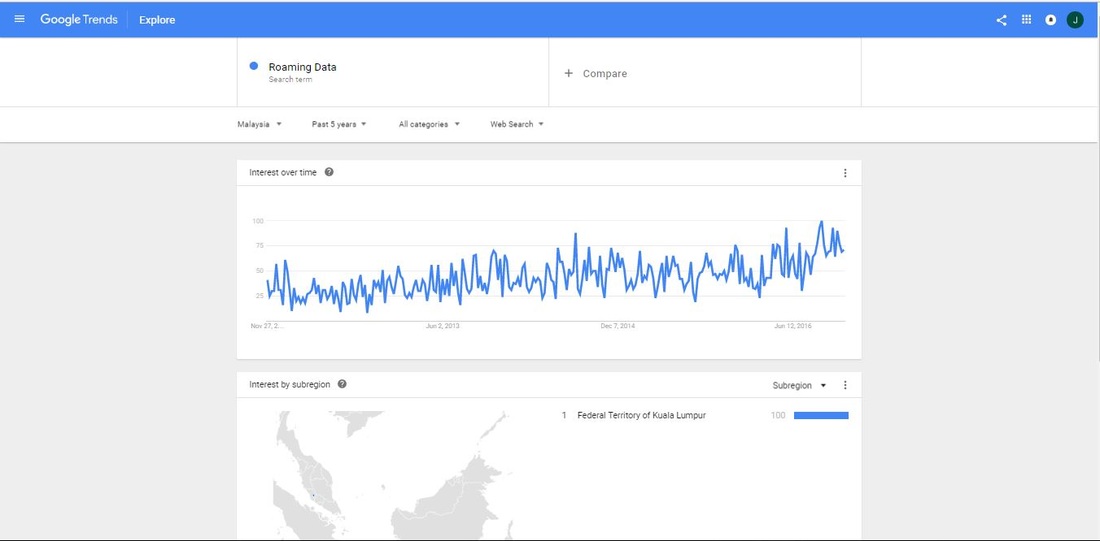
The last chart shows the graph of consumers searching for the keyword “roaming data” throughout the 5 years. During this 5 years, the highest search for using this keyword appeared on 3rd – 9thJuly 2016. These few days has the highest search due to Hari Raya Aidilfitri and resulted many people take the opportunity to travel during this period of time.
However, the lowest search for using this keyword was found on 15th-21st January 2012 with only 11 searchers. As a result, the agency can conclude that consumers are trying to improve their lives to be more convenient each year by using roaming data during their holidays. On top of that, consumers who often search for this keyword are from Federal Territory Kuala Lumpur.
However, the lowest search for using this keyword was found on 15th-21st January 2012 with only 11 searchers. As a result, the agency can conclude that consumers are trying to improve their lives to be more convenient each year by using roaming data during their holidays. On top of that, consumers who often search for this keyword are from Federal Territory Kuala Lumpur.
MARKET SURVEY FEEDBACK SUMMARY
A total number of 127 respondents were managed to complete this survey. The purpose of conducting this survey is to monitor customer satisfaction, measuring market perception and to identify improvement opportunities.
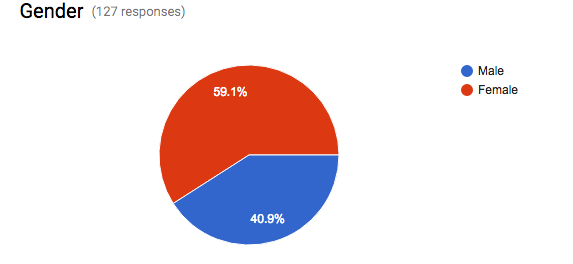
Based on our market survey feedback, we managed to receive a total number of 127 responses. According to these respondents, majority of our target audience are female. Female has a total number of 59.1% whereas male only have 40.9%.
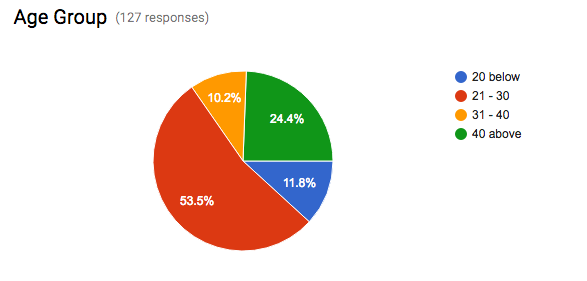
According to the survey, most of our respondents are from age 21 – 30 years old. The highest percentage 53.5% belonged to this age group. This group of people are mostly fresh graduates and executives positions or above.
These people travel the most compared to the rest age group. The second highest that completed the survey questionnaire was the age group that falls under 40 years old above with 24.4% then 20 years old below comes next with 11.8%.
The least age group that completed the survey questionnaire was the age group that falls under 31 – 40 years old. Hence, from this we can understand that target audience who belong to 21-30 years old are the most interested towards this product.
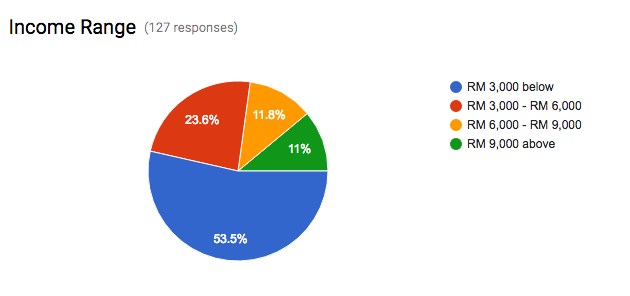
Based on the chart above, most of the respondent that has completed the survey questionnaire earn less than RM 3,000. It has the highest score of 53.5%. This group of people are mostly students, fresh graduates or executives’ positions. Respondents who have income between RM3, 000 to RM6, 000 comes second with 23.6%.
Then 11.8% of respondent who earn RM 6,000-RM 9,000 comes next. The least percentage from the chart above was shown as 11%. This group of people earn the highest. However, they do not have time to complete our survey.
Customers that earn RM 3,000 below have more time. Therefore we can conclude that the higher the position of a customer, the more time they could spend on completing this survey.
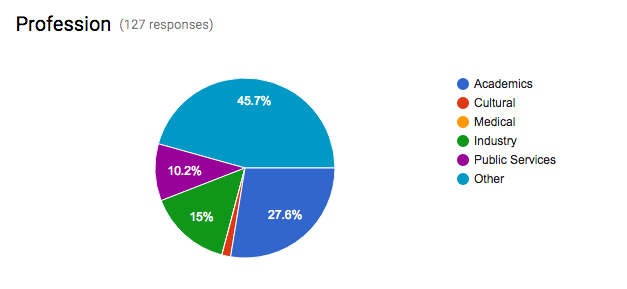
By referring to this chart, the highest percentage that completed our survey was 45.7% that comes from others. Then academics come second with 27.6% and industry come next followed by public services. There is no statistical number for cultural and none of the respondents were from the medical industry.
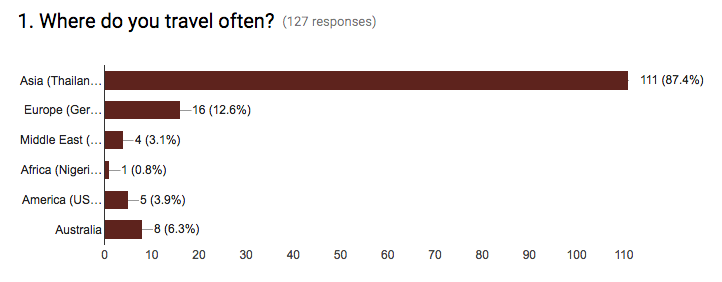
Based on the survey, 87.4% of respondents often travel to Asia country such as Thailand, Indonesia, Japan, South Korea and others. Asia countries are much cheaper and nearer compare to other countries. Europe countries come second with 12.6% of respondents. Europe countries include Germany, Ireland, France, Greece and more. Australia comes next with only 6.3% of respondent, followed by United States with 3.9% of respondents.
The least country that respondent travelling is to Middle East countries and Africa. 3.1% of respondent travel to Middle East country and 0.8% of respondent often travel to Africa.
The least country that respondent travelling is to Middle East countries and Africa. 3.1% of respondent travel to Middle East country and 0.8% of respondent often travel to Africa.
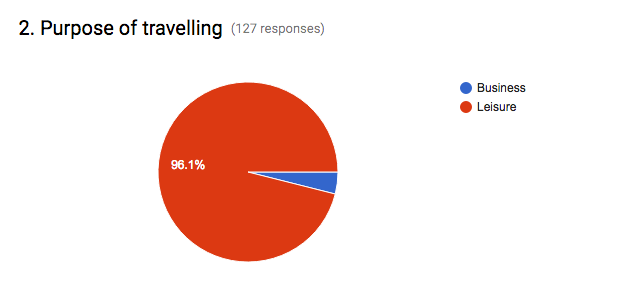
Most of the respondents who completed our survey travel because of leisure. It stated that there are 96.1 % of respondent travels due to leisure. This group of people will probably travel twice a year or only during holidays compared to respondents who travel frequently due to business purpose. Customers who travel due to business purpose will tend to travel more. They are also known as the frequent flyers. These people tend to travel the most within a month or a year.
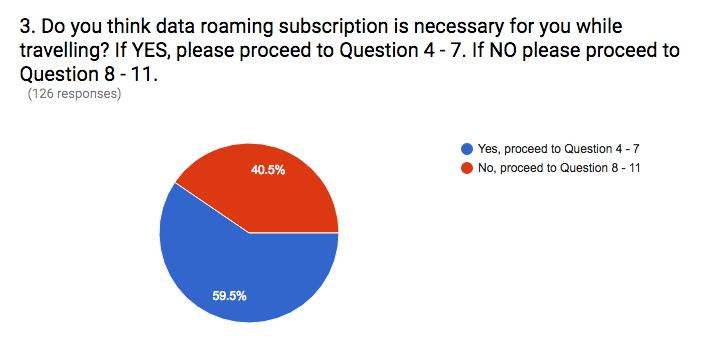
According to this chart, most of the respondents agreed that data roaming subscription is necessary while they’re travelling. There were 59.5% of respondents proceed to questions 4 – 7. They agreed that data roaming is important for them to connect with their families and friends. On the other hand, there were 40.5% of respondents that disagree with this. They prefer using Wi-Fi to stay connected. Some respondents might think that it is unnecessarily to use the phone when they’re enjoying their holidays.
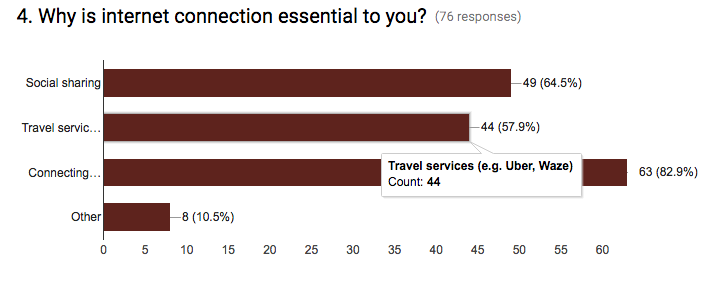
This chart explains why an internet connection is essential to them. Majority of the respondents were agreed that internet was being used to connect with their families and friends. 64.5% of respondents will use the internet connections for social sharing. 57.9% of respondents use for travel service such as Uber and Waze while they were travelling. From this chart, we can clearly identify that internet is the best use to connect your families and the love ones.
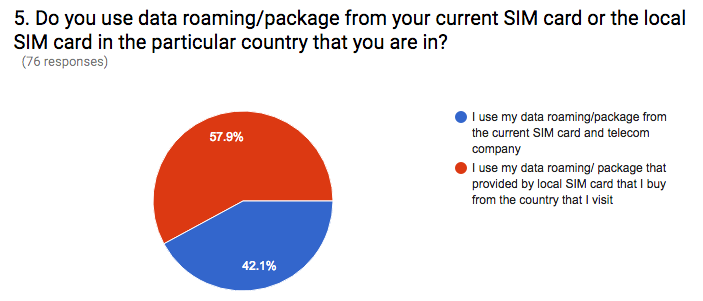
This chart indicated that 57.9% of respondents have used their own data roaming / package that provided by local Sim card which bought from the country that they’ve visited. However, 42.1% of respondents use their own roaming/package from the current Sim card and telecom company while traveling. Customers who always use international roaming or call when they are traveling will receive expensive charges. Therefore they rather buy local sim card for data roaming whenever they travel to a certain country. Hence, it is best to introduce Flexiroam X to everyone who loves to travel. Customers are able to receive free data by referring their friends and families.
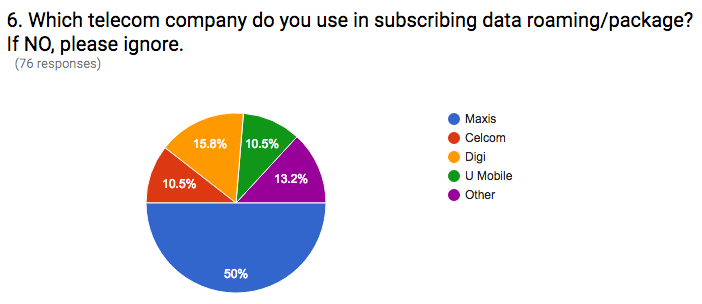
By referring to this chart, we can indicate that majority of the respondents that completed this survey were Maxis user. Maxis are the biggest Telco Company that most of the respondent subscribes to. Digi comes next with 15.8% followed by others with 13.2%. Other includes Webe, or any other international Telco company. However, U Mobile and Celcom have the same amount of percentage which was only 10.5%.
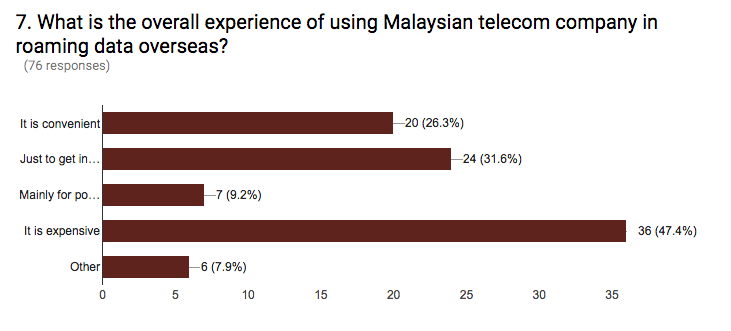
This graph shows the overall experience of using Malaysian Telecom Company in roaming data overseas. There were 47.4% of respondents agreed that it is expensive to use Malaysian telecom to roam data overseas. However, 26.3% respondents used Malaysian telecom just to get connection and 26.3% of them agreed that it is convenient to use Malaysia telecom to roam data in overseas. Nevertheless, there were 9.2% respondents agreed that using Malaysian telecom in overseas is mainly for posting on social media.
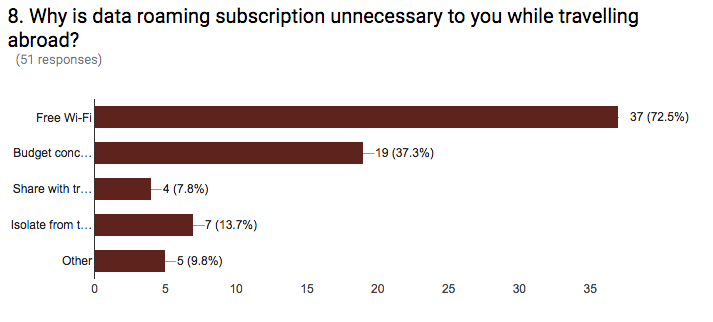
The above graph explains the reasons about the unnecessary of using data roaming during traveling. The main reason for not subscribing to data roaming is because customers tend to search for free Wi-Fi during their traveling period. However, 37.3% of respondents do not want to subscribe to data roaming due to budget concern and 7.8% of respondents would rather share data with their travel partner in order to save cost. Then 13.7% respondents prefer isolated from the digital world. This group of people would rather spend their time on holidays and not using their phone to get updates. Their purpose for going on a holiday trip is to enjoy and relax.
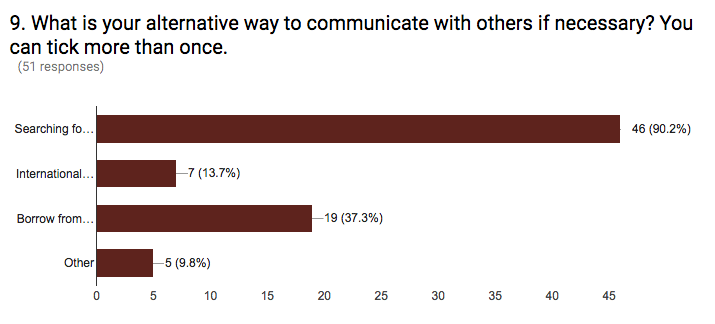
This diagram shows the alternative way to communicate with other if there is a necessary. If there is a necessary, majority of the respondent will search for a free Wi-fi spot to get themselves connected. 37.3% of the respondents will borrow or lend from their travel partners who have accessibility to the internet. The remaining 13.7% respondents would rather use an international call if there is a necessary or urgent.
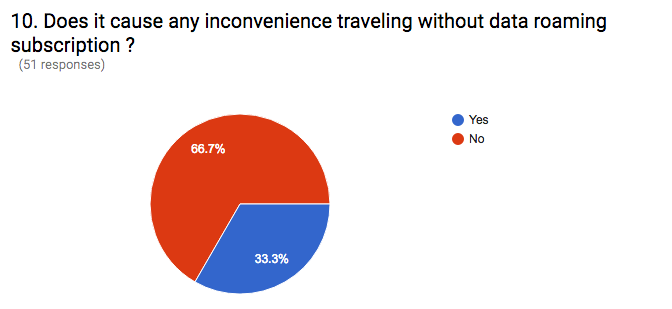
Based on the chart above, 66.7% of the respondents agreed that it is convenient to travel without data roaming subscription. These people tend to look for a Wifi spot to get an internet connection. On the other hand, 33.3% of the respondents agreed that it is inconvenience travelling without data roaming subscription. This group of people is mostly the frequent flyers or travel for business purpose. Hence, these people have to subscribe for data roaming each time before they travel. They need to stay connected even though they went for holidays. They will miss out a lot of important information or messages if they do not subscribe for data roaming.
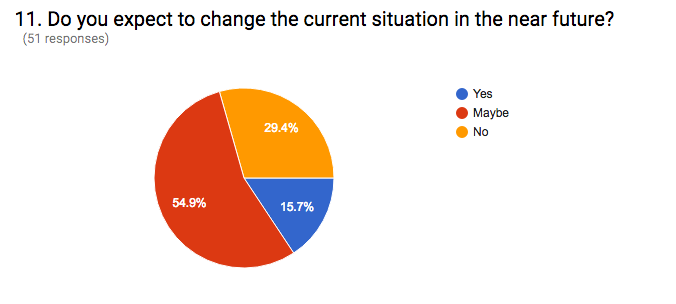
For this chart, majority of the respondents choose to answer maybe. They haven’t made up their mind yet. This group of people still do not understand more about Flexiroam X. However 29.4% of the respondents do not want to change the current situation in the future. This group of people still depend on Wi-Fi compare to data roaming. The remaining of 15.7% respondent would start to make a change in the future in order to make their live more convenience.
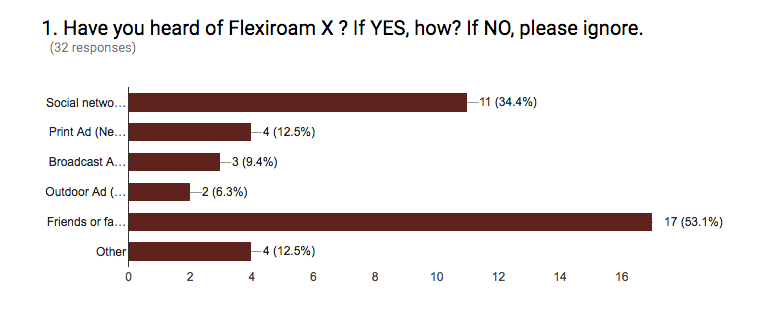
According to the chart above, majority of the respondents heard about Flexiroam X from their friends and families. 34.4% of respondents said they get to know about Flexiroam through social networking such as Facebook, YouTube, and others. The least that respondent used to expose to Flexiroam X is through Outdoor advertising. This includes Billboard, transit, and others. Outdoor advertising is costly compared to social media or through family and friends. Hence, using social media and get to know about Flexiroam X through friends and family to spread awareness is more cost effective.
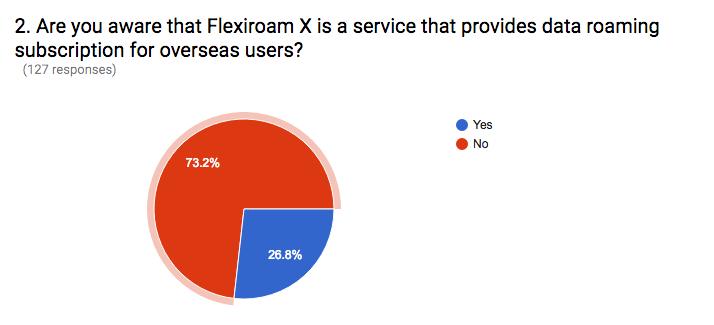
By looking through this chart, even though the respondents heard of Flexiroam X through family and friends but they still do not know much about the product. According to the information that we collected, 73.2% of respondent still do not know that Flexiroam X is a service that provides a subscription for overseas users. On the other hand, 26.8% knew about the brand. Hence, Flexiroam X should increase their brand awareness to reach out more people.
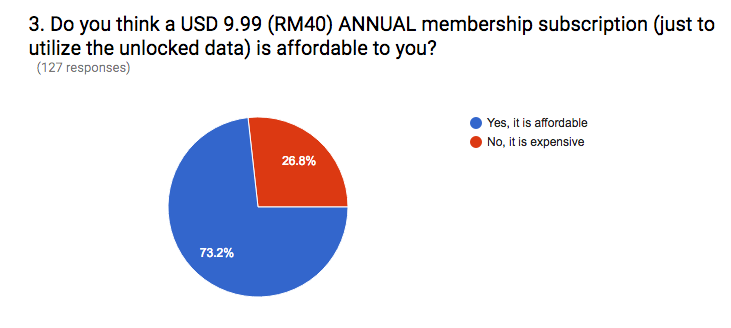
Based on this chart, the majority of the respondent agreed that a USD 9.99 which is RM40 annual membership subscription is affordable to them. Compare to other competitors, RM 40 subscription for a year is affordable for everyone. In other words, customers would only spend less than RM3 for a month. However, there are 26.8% of respondent disagree with this statement. They think that RM40 is not affordable. They rather choose to search for Wi-Fi or pick other brands.
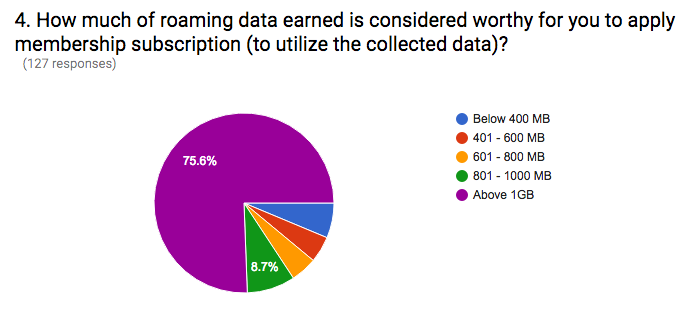
By referring to this chart, respondent think that a membership subscription should earned more than 1GB. To collect free data, customers need to refer to their friends. 75.6% of respondents agreed that a RM 40 membership subscription is much worth for more than 1GB. This group of people are mostly the frequent flyers or people who are more active on social media. Hence they prefer more data. 8.7% of respondent feels that 801- 1000 MB is worth for a RM 40 membership subscription. This group of people only need to use their data when there is necessary or when they’re travelling. There are also people who think that less than 800 MB is worth for a membership subscription. This group of people are mostly the one who uses less data. They’re purpose is to enjoy and relax while they’re travelling.
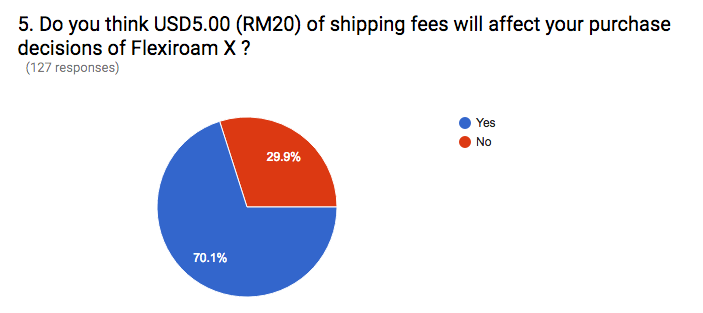
Most of the respondents think that USD5.00 (RM20) of shipping fees will affect their purchase decisions of Flexiroam X. The 70.1% respondent would prefer a lower price or they would rather get themselves a membership subscription before they depart at the KLIA airport. These people are mostly the low to middle income target audience. The remaining 29.9 % of respondent are mostly the high income target audience. They agreed that the cost of RM 20 shipping fees will not affect their purchase decision of Flexiroam X.
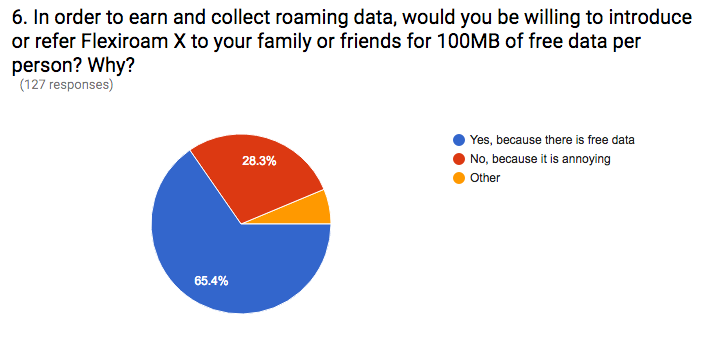
By earning and collecting roaming data, 65.4% of respondents are willing to introduce Flexiroam X to their family or friends for 100MB. Since there is an opportunity to collect free data, customers will rather spend their time refer or introduce Flexiroam X to their family and friends. However, 28.3% of the respondents feel that it is annoying to refer to their friends to collect free data. This group of people does not have much time or not social enough to collect data by referring to their family and friends.
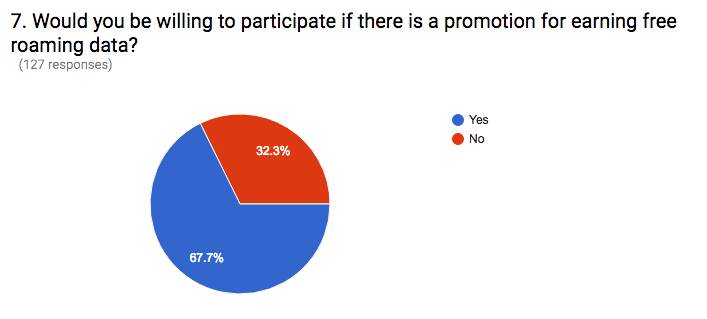
Based on the above chart, if there is a promotion for earning free roaming data, most of the respondent would willing to participate. 67.7% of the respondents are willing to join the promotion. It’s human nature that every customer would love to participate to receive free benefits. But 32.3% of respondent are not willing to participate. This group of people could be lazy or they do not have time to join or participate earning free data.
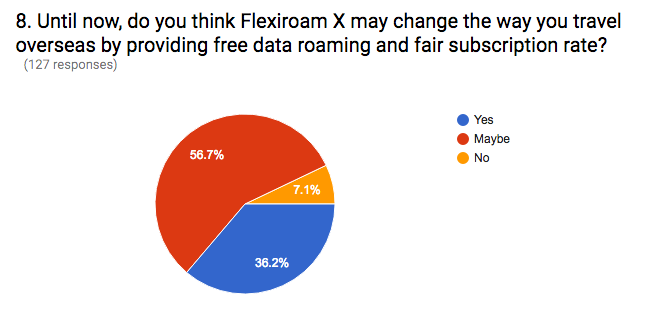
According to this chart, 56.7% of respondent still not sure that Flexiroam X may change the way the travel by providing free data roaming and fair subscription. In this case, respondents need to further understand the brand more in detail. However, after explaining much about Flexiroam X, it is successful that 36.2% of respondents agreed that Flexiroam X may change the way they travel by offering free data roaming.
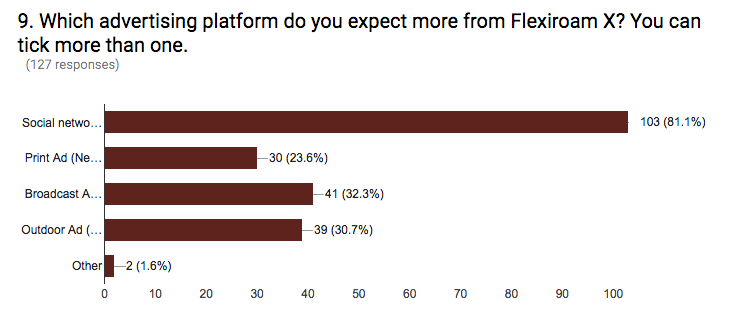
According to this chart, majority of the respondents suggested Flexiroam X to use social networking as the advertising platform. This includes using Facebook, YouTube, Instagram and others. Also, it is much cost effective to use social Network as an advertising platform to reach a larger audience. Next, 32.3% of respondents would prefer Flexiroam to use broadcast advertising as an advertising platform. Even though broadcast advertising is costly, but it is an easy and convenient way to deliver the message to one another. However, some respondent also voted print ad and outdoor advertising as an advertising platform but it is still the best to use social network to deliver message to all the customers. Social network is more time saving, easy and affordable for a brand to create bigger awareness.
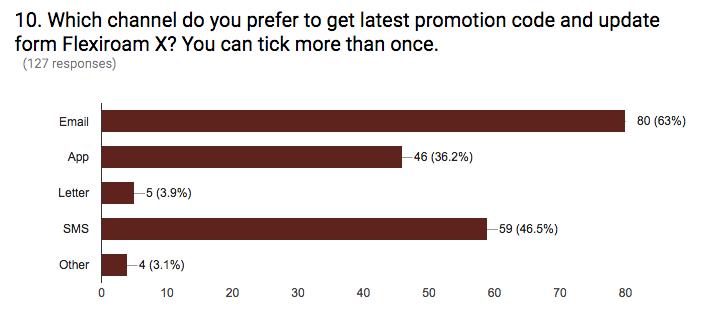
Majority of the respondents would prefer to get the latest promotion code and updates from Flexiroam X through Email and SMS. Email has the highest votes with 63%, whereas SMS comes second with 46.5%. Apart from that, some respondent choose to receive latest promotion and update through Apps and letter. However, it is more convenient, fast and free to use email to update all the customers. Hence, email is the most wanted channel for Flexiroam X to use for sending out the latest updates and promotion to their potential customers.
